Databricks Data Profiler
Data Profiling is the process of examining, analyzing, and summarizing a sample dataset to gain insights into the quality of data, based on the selected parameters. In the Calibo Accelerate platform to add a data profiler stage, do the following:
-
Add a data quality stage after the data lake stage.
-
Add a data profiler node to the data quality stage. Connect the node to and from the data lake, as shown below:

-
Click the data profiler node and then click Create Job to create a data profiler job.


Note:
The Profiler Result tab is visible only after you run the job for the first time. If you use the Validate constraint in your profiler job, then you can also view the Validated Profiler Result.
-
Provide the following information for the data profiler job:
 Job Name
-
Template - This is automatically selected based on the stages added to the pipeline.
-
Job Name - Provide a name for the data profiler job.
-
Node Rerun Attempts -Select the number of times the job is rerun in case of failure. The default setting is done at the pipeline level.
-
Fault tolerance - Select the behaviour of the pipeline upon failure of a node. The options are:
-
Default - Subsequent nodes should be placed in a pending state, and the overall pipeline should show a failed status.
-
Skip on Failure - The descendant nodes should stop and skip execution.
-
Proceed on Failure - The descendant nodes should continue their normal operation on failure.
-
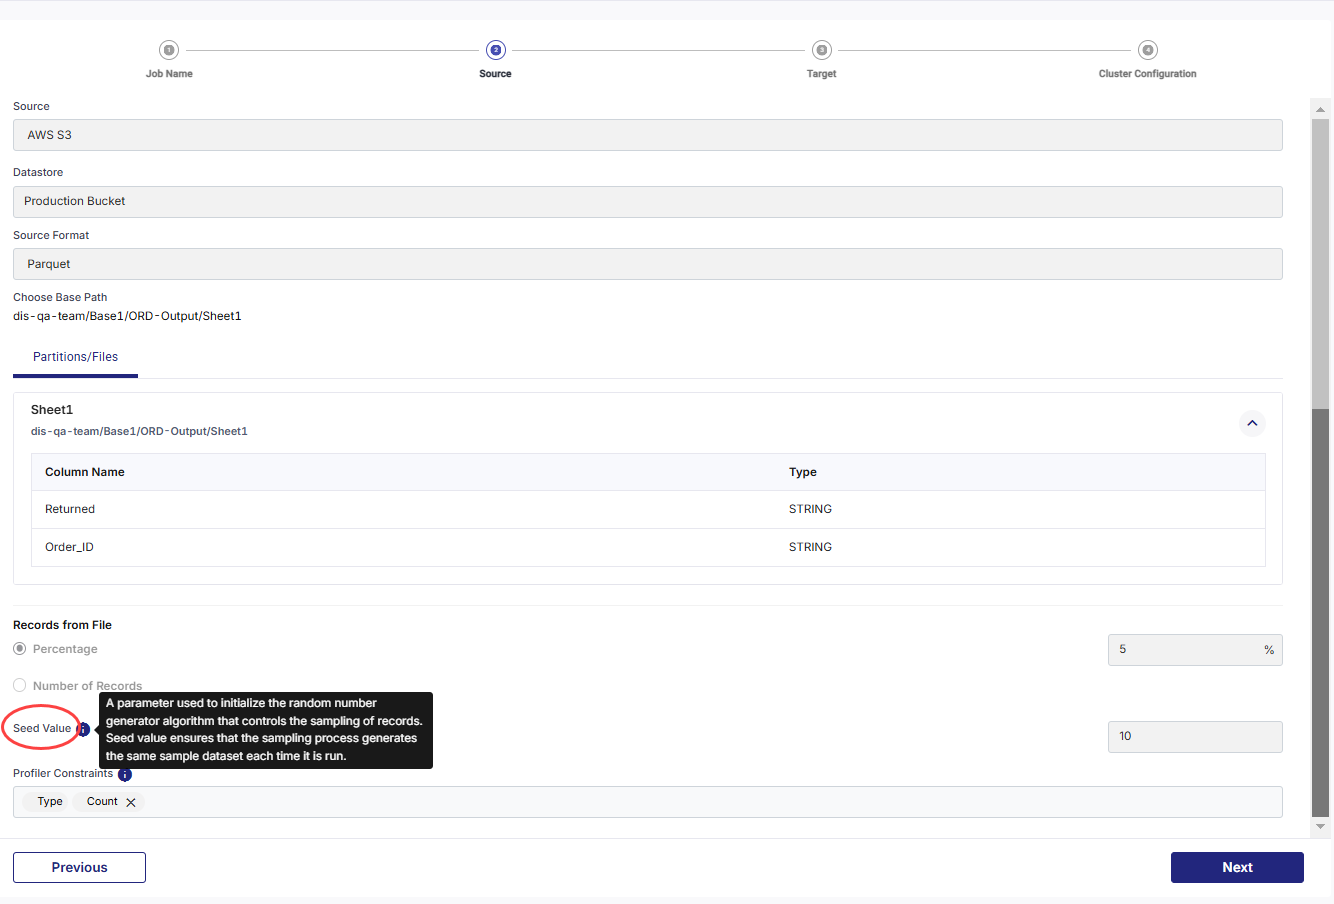
Source
-
Source - this is automatically selected depending on the type of source added in the pipeline.
-
Datastore - this is automatically selected depending on the configured datastore.
-
Source Format – The Parquet option is automatically selected.
-
Choose Base Path – Select the path, where the source file is located.
-
Records from File – Select one of the following options:
-
Percentage - Provide the percentage of records to be processed in the data profiler job.
-
Number of Records - Provide the number of records to be processed in the data profiler job.
-
-
Seed Value - Provide a number that initializes the random number generator algorithm that controls the sampling of records. This ensures that the same sample dataset is generated each time the profiler job is run.
-
Profiler Constraints – Select the constraints on which you want the data profiler job to run. Choose from:
-
Completeness – Checks whether the data fulfill the expectation of comprehensiveness. For example if customer name is asked, then whether first name and last name are present for all records. If either of the two is missing the record is incomplete.
-
Validity – Checks whether data is available in the prescribed format. For example, in case of date of birth, if the specified format is mm:dd:yy and data is provided in dd:mm:yy format, then the record is invalid.
-
Count - Provides a count of the following type of records in each column:
-
Distinct - Values that are distinct, even if they appear multiple times.
-
Filled - Values that are not empty.
-
Null - Values that are null.
-
-
Character Count - Provides a count of the following type of records in each column:
-
Numbers - Values that are alphanumeric.
-
Numbers Only - Values that are only numeric.
-
Letters - Values that are alphanumeric.
-
Letters Only - Values that are only alphabtical.
-
Numbers and Letters - Values that are alphanumeric.
-
Special Characters - Values that have special characters.
-
-
Statistical Value - Provides details about the following values in the records:
-
Minimum - The maximum value amongst the records.
-
Maximum - The minimum value amongst the records.
-
Mean value - The average of the value in the records.
-
Standard Deviation - Measure of variation from the average value.
-
-
Recommendation - Information about columns that are not null.
-
Target
-
Target – This is automatically selected depending on the type of target you select in the pipeline.
-
Datastore – This is automatically selected depending on the configured datastores to which you have access.
-
Choose Target Format – Select Parquet.
-
Target Folder – Select the target folder when you want to store the data profiler job output.
-
Target Path – Provide an additional folder path, which is appended to the target folder.
-
Audit Tables Path – This path is formed based on the folders selected. This is appended with a folder Data_Profiler_Job_audit_table.
-
Final File Path – The final path is created in two folders – TempProfilerOutput and then ProfilerOutput.
Cluster Configuration
Select one of the following options:
-
All Purpose Cluster - Select a cluster from the dropdown.
Note:
If you do not see a cluster configuration in the dropdown list, it is possible that the configured Databricks cluster has been deleted.
In this case, you must create a new Databricks cluster configuration in the Data Integration section of Cloud Platform Tools and Technologies. Delete the data integration node from the data pipeline, add a new node with the newly created configuration, and configure the job again. Now the user can select the newly configured Databricks cluster.
-
Job Cluster - Create a cluster that is specifically used for this job. Provide the following details:
-
Cluster Details
Choose Cluster Select a cluster. Job Configuration Name Provide a name for the configuration. Databricks Runtime Version Provide the version of Databricks that is used. Worker Type Select a configuration for the worker node. Workers Specify the number of worker nodes required for this job. Enable Autoscaling Enable this option and specify the following:
-
Min Workers - minimum number of workers.
-
Max Workers - maximum number of workers.
Databricks chooses the appropriate number of workers required to run the job, from the provided range.
-
-
Cloud Infrastructure Details
First on Demand - lets you pay for the compute capacity by the second. Availability - select from the following options:
-
Spot
-
On-demand
-
Spot with fallback
Zone - select a zone from the available options. Instance Profile ARN - Provide the ARN for the AWS instance on which the Databricks cluster is deployed. EBS Volume Type - Select the type of EBS volume being used for the AWS instance. EBS Volume Count - Specify the number of EBS volumes to be used for the AWS instance. EBS Volume Size - Select the size of the EBS volume. -
- Additional Details
-
Spark Config Environment Variables Logging Path - select one of the following options:
-
DBFS - provide the path for storing the logs on DBFS.
-
S3 - provide the path for storing logs on S3 and select the region.
Init Scripts - select one of the following options and provide the required details:
-
Workspace
-
DBFS
-
S3
-
-
-
-
After you create the job, you can run the job in the following two ways:
-
Publish the pipeline with the changes and then run the pipeline.
-
Click the Data Profiler node, and click Start.

-
-
Click View Profiler Results to view the results of the Data Profiler job. After viewing the results, you can validate columns based on a specified pattern.

-
Specify the pattern for validation and click Validate to validate the data in the selected columns based on the provided pattern.

Note: The pipeline must be in Edit mode for the Validate button to be enabled.
-
Click Start or run the pipeline to run the validation job. Once the job is complete you can view the results of that job under the Validated Profiler Result tab. You can download the results in the form of a CSV file.
| What's next? Databricks Data Analyzer |